
The Kingly Chases
A data backed take on why Kohli is a modern day ODI chase master

In run chases in the history of the game, there is Virat Kohli, there is daylight and then there are rest.
The biggest question with a healthy required run rate in front of you when you come to bat at number 3 is: how should I play? The problem with ODIs, unlike T20s, is that 50 overs are usually enough to bowl a team out. Hence, in addition to keeping up with the required run rate (RRR), there is the added challenge of wicket preservation. Those who can manage both tasks win you run chases. An ODI chase, therefore, needs to be judged on two broad aspects: the effect on the required run rate and the effect on wicket preservation. Let’s call them the Run Scoring Factor (RSF) and the Wicket Preservation Factor (WPF) respectively.
We are dealing with simple statistical counterfactuals here. I ask: what would the required run rate have been had the batter not played the innings he played? Similarly, I ask: how many balls per wicket would the team have had to face if the batter had not played the balls he faced? These values are then compared to the actual RRR and required balls per wicket (BFPW) at the end of the batter’s innings in a chase. The differences are calculated as a percentage of a base value, which is taken as 1 run per ball for RSF and 30 balls per wicket for WPF.
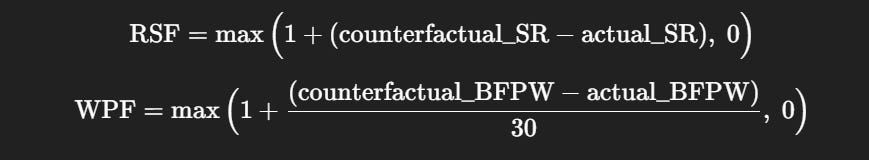
The values have been clipped to be ≥ 0 in cases where they would otherwise be negative. Hence, innings that increase the RRR by more than 1 run per ball or increase the required balls per wicket by more than 30 are given a score of 0. Such cases, however, are extremely rare.
THE BALANCING ACT
A multiplication of these two factors gives us the Chase Contribution Value (CCV) of a second-innings ODI knock. Here’s how some seasoned pros (minimum 50 second-innings knocks since 2010) perform on these two metrics:
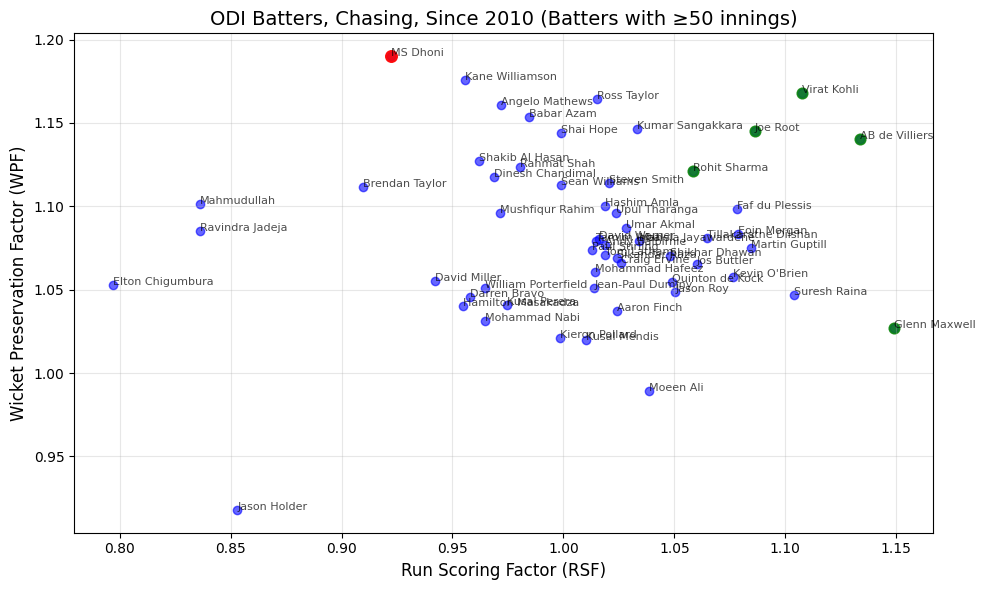
Virat Kohli and AB de Villiers leave little to choose between them. Both outperform the other in one aspect each. The final CCV score, however, is where Kohli takes the lead. And for those who value longevity, Kohli has done this over 99 more innings than ABD. Even with a 25-innings filter, Kohli and ABD remain the top two, with Ambati Rayudu taking number 3.
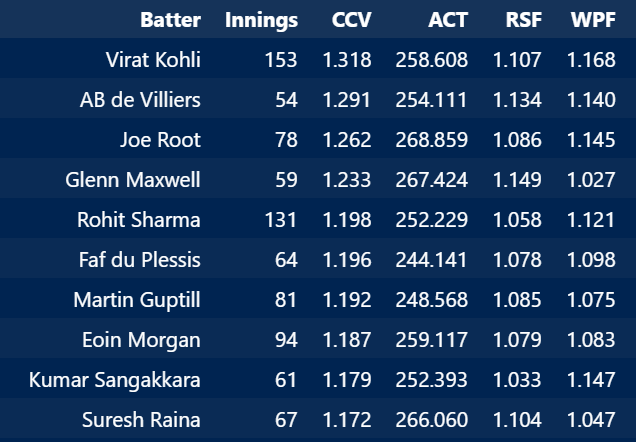
This list has the top 10 batters based on CCV. ACT here is the Average Chasing Target. Lets us breakdown CCV now to look at individual RSF and WPF numbers.
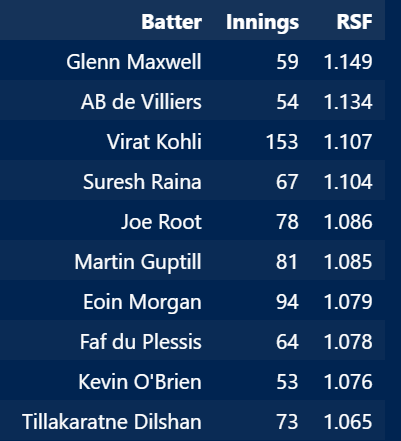
Glenn Maxwell is an interesting case. His RSF dominates heavily. In ODI chases, Maxwell’s numbers are 35.5/122.5 — impactful for the position he bats at. Another surprise is Suresh Raina, who seems to have played more good knocks than he is generally remembered for.
Kohli does it a bit differently from players like Maxwell and Raina. Because he faces more balls, he can influence the required run rate at a relatively risk-free pace. This metric works nicely because it accounts for both balls faced and strike rate. For example, if Kohli plays a 90(100) in a 250 chase, he leaves his teammates needing a strike rate of 80. In a similar situation, if Maxwell faces only 50 balls, he must score at run-a-ball to leave the same required strike rate of 80. The metric thus captures the fact that it is easier to score at higher strike rates over shorter stays at the crease.
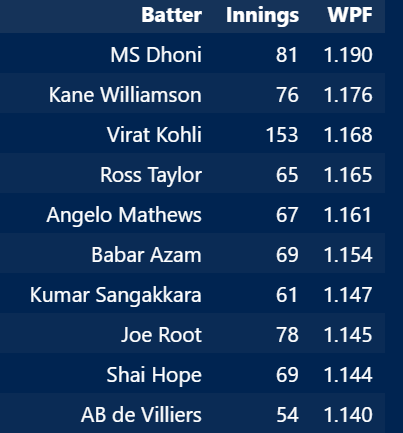
There isn’t much debate about the players ranked 2 to 10 in terms of wicket preservation. The Williamsons, Sangakkaras, and Babars have all anchored their batting orders for most of their careers. An intersection of the top-10 WPF and RSF lists gives us three names that stand out as the cream of ODI chasers: Kohli, ABD, and Root.
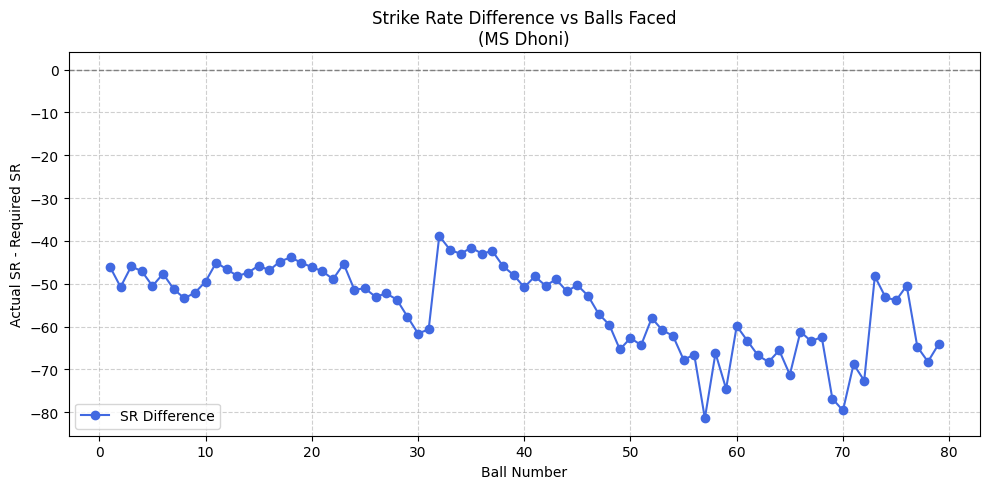
With MS Dhoni, I’ve always wondered whether he was batting one, if not two, positions too low — especially during times when India struggled for solid number fours and fives. I created progression graphs that show the difference between the required run rate and the batter’s strike rate (both in runs per 100 balls), averaged over all chasing innings. An average MS Dhoni knock never quite matches the required run rate for any number of balls faced. This was true for only 9 batters out of 56 who had played a minimum of 50 chasing innings. Two of those 9 were Sangakkara and Williamson, but in their cases the batting position justified a greater inclination toward WPF, even at the expense of RSF. That, however, was not Dhoni’s situation.
THE SWEET ZONE AND OVERS 10 TO 40
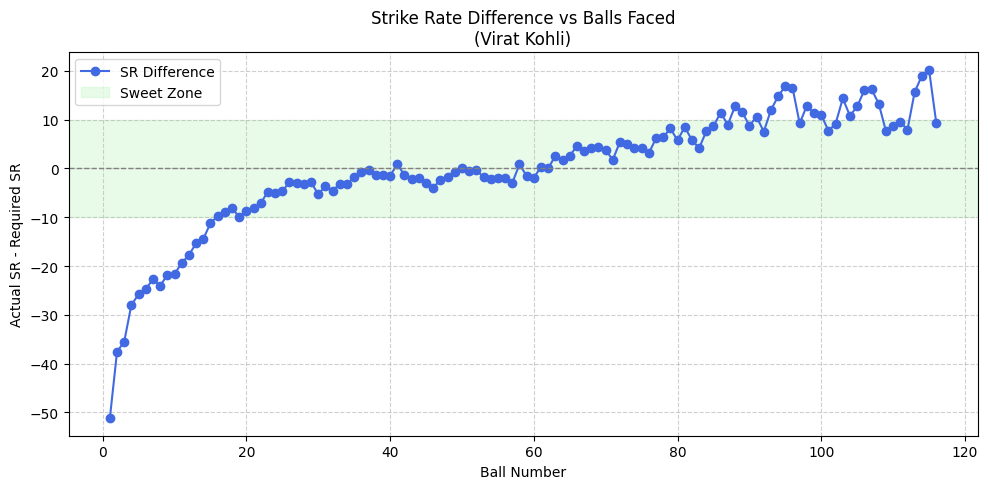
Inning progression is again where Kohli shines. This is how his difference graph looks like -
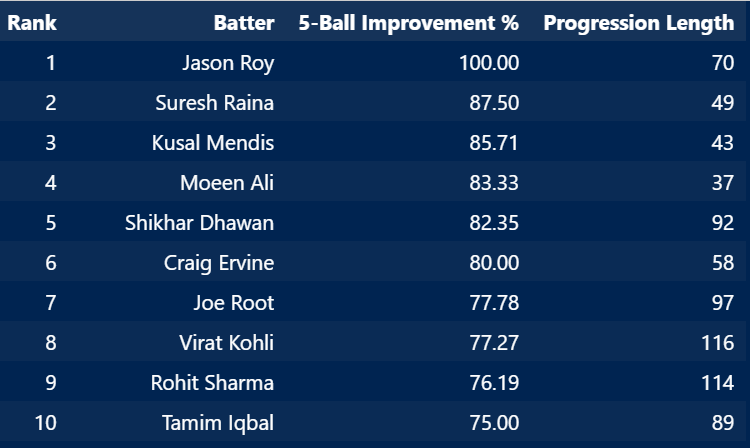
A very good quality is how the plot shows consistent improvement. A five-ball improvement rate is defined as the percentage of 5-ball groups where the average difference improves compared to the previous group (for example, a progression of 45 balls will have 9 such groups). Kohli improves in 77.27% of these groups and has the highest progression length (number of balls faced with ≥10 instances).
He stays close to the RRR from about the 20th ball and then never drifts away. The small gap Kohli maintains is another aspect worth appreciating. On average, he stays within 0.1 runs per ball of the RRR (absolute difference). In non-absolute terms, Kohli is 0.064 behind the RRR. Only 8 (out of 56) batters actually manage to stay ahead of the RRR on average, but most of them struggle with WPF. Only De Villiers manages a top-20 WPF while keeping a positive average distance.
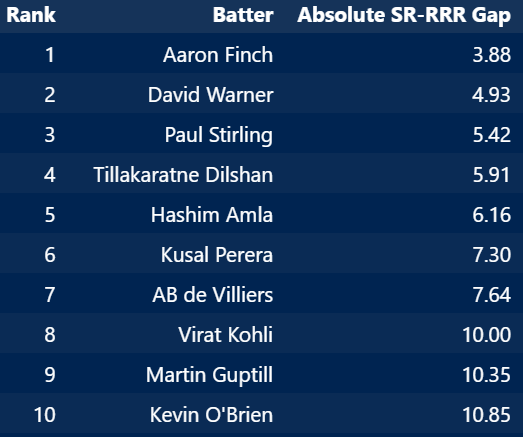
Kohli thus is able to find a sweet zone around the rrr which helps him manage the balancing act. And this is the phase of play where Kohli probably distances himself from others of his era. This sweet zone mostly coincides with a 30 overs span of boring ODI play. What helps him sustain it? His running between the wickets.
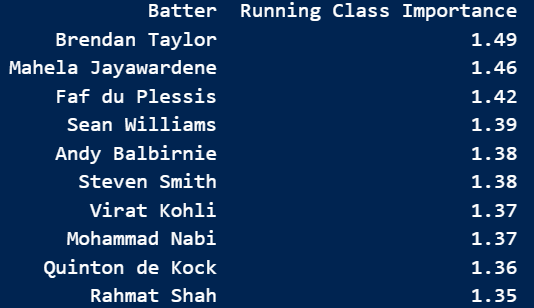
An analysis I did to find optimal field settings for batters highlighted the importance of different zones for “running-class” and “boundary-class” runs. The importance of a zone was defined as the probability of playing a shot there multiplied by the strike rate in that zone (calculated separately for running and boundary runs). Summing across all zones gave the overall importance of running-class and boundary-class runs. Kohli in overs 10 to 40 when chasing has one of the best running class importance values.
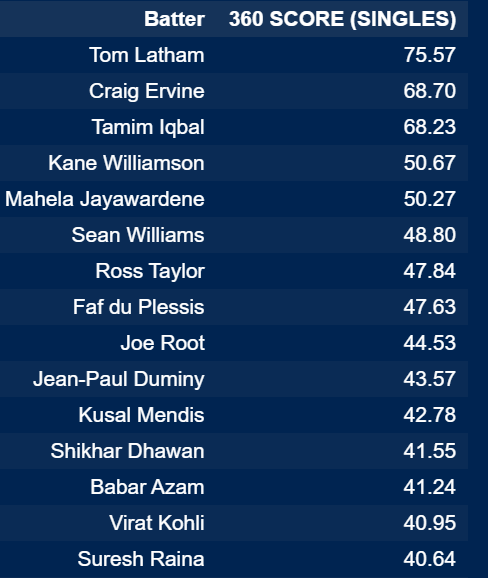
His zone versatility when it comes to singles enables him to maintain a low dot-ball percentage. Kohli’s 360 score for singles in this phase ranks 14th. De Villiers ranks first when it comes to all running-class runs (1s, 2s, 3s). Joe Root, the third batter consistently mentioned alongside ABD and Kohli, ranks 9th and 5th respectively in these two lists. This goes to show how a good ability of being able to score risk free runs in this 30 overs phase enables batters to manage both expectations effectively.
Is there daylight then between Kohli and others? I think he is the best but there isn’t much between him and De Villiers (and maybe Root gets up there as well). After that, though, there probably is a bit of a gap.
Very nice read. I'm sure RSF and WPF could be used to illustrate role specialization in successful chases and also temporal shifts in chasing.
On a related note, had you considered ranking batters by the number of ball groups they spend in the sweet zone?