


UNLOCKING ALL CORNERS OF A CIRCLE
Introducing a new intelligent wagon wheel and metrics to understand 360 degree shot making.

I started following cricket when T20 was a newborn. It’s a famous joke in Indian households that elder kids are expected to follow traditional routes of doctors and engineers while younger kids can follow their passion and go for more exciting glamorous options. T20 was the young child of cricket. And batters are the people who have been given the responsibility of keeping that glamour alive. A T20 batter thus has seen various phases of scrutiny where different aspects of his/her batting have come in the limelight. But one which in my understanding has remained a constant is the focus on 360 degree ability. If I had to make a tier list of different skills I want in my batter, playing all around the ground would probably be second only to timing. It’s a bit surprising thus, that we don’t yet have any sophisticated ways to judge a player’s ability in this aspect.
The boring old wagon wheels

The above image is a wagon wheel from which we want to draw conclusions on, let’s say, Jaiswal’s areas of strength. First of all even to start working on this, you’ll need to clear your head of any other thoughts and give it the utmost attention for a minute (By the way, this is not even the full wagon wheel; it’s just the boundaries). If you are successful in doing so, you’ll probably look for dense regions in the plot and end up concluding that he is good in the deep backward point, mid-wicket and cover areas. Fine. But did we ask what percentage of these shots were intentional? Did we consider the possibility that those regions are denser simply because bowlers bowled more in areas where it’s easier to hit shots there? Any decently muscled player can smack a full toss or a juicy half volley for a six in the V. The wagon wheel does not tell the difficulty of the shot or the control of the shot. Also, it is subjective, since it’s visual interpretation. And, it’s tiresome!
Quality vs Quantity
As discussed above, the traditional wagon wheels focus only on quantity of the runs. In determining a player’s area of strength they miss two important factors – quality and control of the shot. Getting the latter correct is pretty easy if you have data with control labels, simply exclude all the edges and unintentional shots. For the quality part I have considered the line and length of the delivery to be the most crucial factor. Almost all lines and lengths have one or two intuitive regions to which any average batter would hit the ball. For example a full length on the off to the covers or a straight short ball towards square leg or mid wicket. A batter’s 360 ability has a lot to do with how many not so natural regions he/she is able to access on any particular delivery and those shots need to be rewarded more than the natural ones. A simple example is Kohli’s famous six off Rauf at the MCG.
The quality of a shot is given by shot difficulty.

The 360 degree ability and a new wagon wheel
Combining now the quantity and quality we can carry forward this discussion to find out a batter’s 360 degree ability. I have used vectors to help me out here. Firstly, I introduce a scoring vector. The direction of this vector is the direction of the shot. The magnitude is given by –

With these vectors (the blue lines in the below figures), we have created our intelligent wagon wheels.
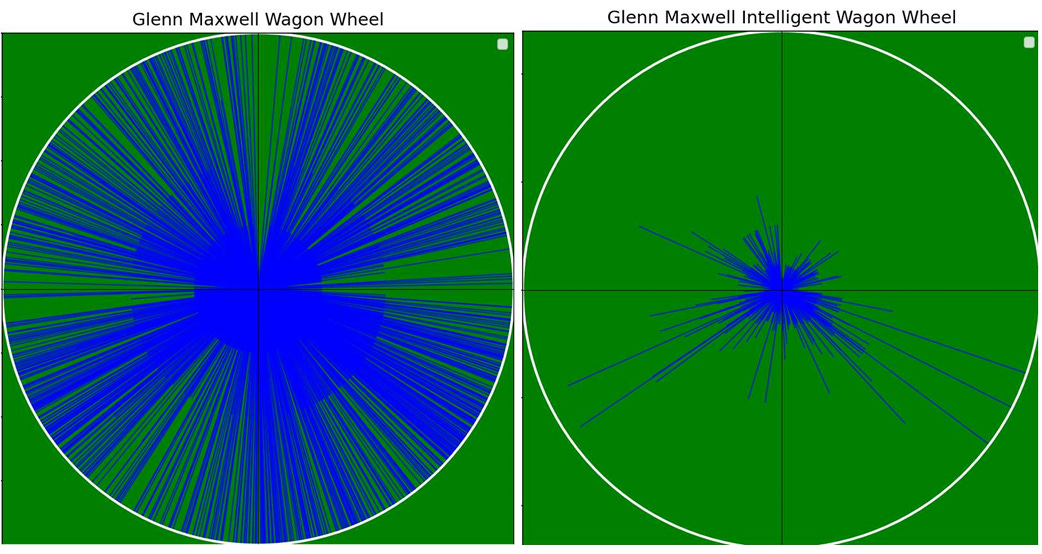
As seen above, one can easily identify Maxwell’s key areas with a single look at an intelligent wagon wheel. Something which traditional wagon wheels don’t provide. It is hard to believe that both wheels have exactly the same number of shots, intelligent wagon wheel is just able to separate out quality regions better.
To put a player’s ability in numbers, I also created a 360 score.
The top performers and some insights
(All rankings/lists include a total of 76 players with >=2500 T20 runs)
Now that the whole path is set for analysis, lets look at some important names. These are player rankings based on the ability score we just talked about -

Suryakumar Yadav would have been a popular choice intuitively as well. Infact, he ranks 1 even in the category of ‘average shot difficulty’, making him almost an outlier to compare anyone with. Nitish Rana, Rahmanullah Gurbaz are names which go unnoticed a bit. The likes of Maxwell, Buttler, Karthik are again not surprising to feature in this list. De Villiers (13th) and Pant (12th) are also some obvious names having a good score.

To carry out a region wise analysis, I have divided the field in 4 major areas, offside (blue), straight (green), legside (yellow) and behind (violet). For lefties, blue and yellow will exchange places. Next I have divided the analysis in 3 parts – based on quantity, based on quality and combined. Consider this for example -

These are three ranking lists based on -
1. Players with most part of runs scored straight (Quantity)
2. Players having the best quality shots playing straight (Quality)
3. A combined score of both
Kieron Pollard’s dominance in the V is commonly known. But when it comes to quality, David Warner takes the top spot. Andre Russell is the only one present in all three, the guy can probably hit any ball straight with that powerful baseball swing.
This example shows how we can play around with the two aspects of quality and quantity of shots. When talking about specific regions, another point of difference that can be brought out in these two is the percentage of region preferred balls. By region preferred balls, I mean deliveries which have a higher chance of being hit in the region we are targeting. For example, a good length outside off is an offside preferred ball. Consider these two ranking lists based on quantity and quality (respectively) on the offside (blue) along with the percentage of off side preferred balls the batter faced -


The batters in the quantity list have also faced a lot more of their deliveries which have been easier to hit on the off, this is precisely one factor that wagon wheels will miss. Batters like Warner and Maxwell don’t need to rely on having deliveries outside or on off stump to access the off side, with shots like the switch hit in their arsenal. Someone like a KL Rahul or a Williamson on the other hand, have to depend on these deliveries. They are not really known to create room or play reverse bat shots.
Another interesting observation is regarding quality players in the leg side (yellow). All of them have played more offside preferred deliveries than leg.
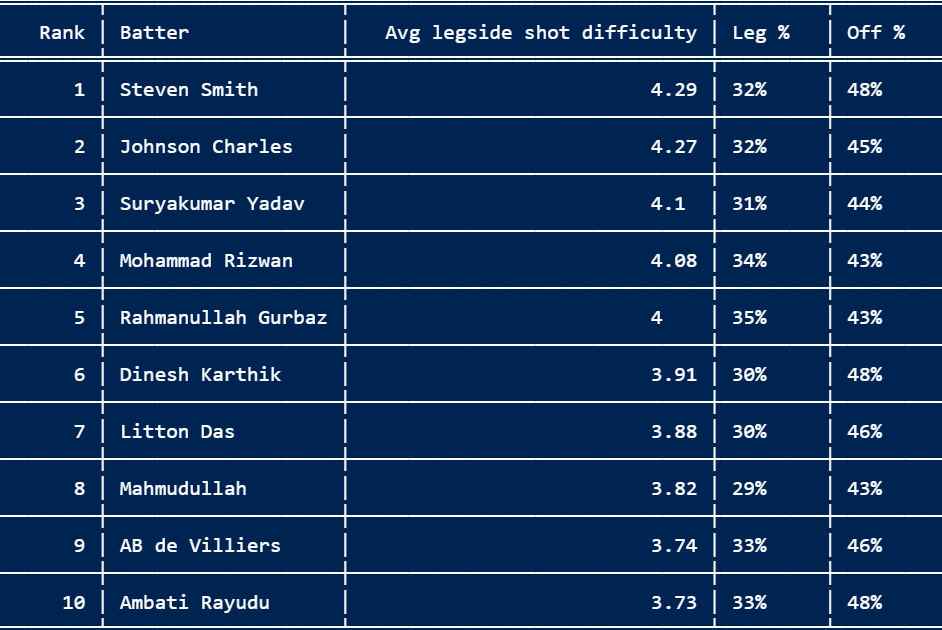
This is actually one of the reasons for them to be ranked high on the list. When someone like a Steve Smith walks across to the 4th or off stump line to flick the ball towards square leg, it is counted as a difficult shot. Again, it comes down to having a low reliance on the kind of delivery to access the legside.
A quality based analysis thus can also help bowling teams against these batters guiding sides to have protection in their regions of strength, even when it doesn’t appear very natural on a particular line-length plan.
To Conclude
All the pieces I write in this space have come as a result of an effort to introduce new metrics with added context for cricket. With this one, I have tried touching an aspect of batting which didn’t have any numerical representation (to the best of my knowledge). I have also modified wagon wheels for simpler visual interpretations and more informed inferences. I am open for discussions and collaborations for further improvements.
Thanks for reading!
Easy to understand and detailed analysis on Wagon Wheels. One observation which I saw was the dominance of lefties (8 out of 10) in Players with highest quality on the off side (quality). That supports the claim that lefties are more pleasing to eyes while playing on the off side.
This is so cool.
Absolutely loved it