
The Real T20 Batting Performance Rankings
A rankings system covering a lot more than just T20Is

There’s a T20 league in every corner of the world. The world’s best players play in them. The standards are rising. T20Is are one part of the global T20 landscape. Thus, a T20 ranking based only on this one part doesn’t make sense. And this is what we get with the ICC rankings. Shubman Gill is 66 on the ICC rankings currently. We know he is much better than that. It's just that he has played a large part of his T20 cricket in the IPL. Steve Smith came out all guns blazing for Sixers in the BBL, but there’s no way to know what those performances mean in terms of where he stands globally. What we need are rankings which include all leagues at the same time, accounting for their relative difficulties.
Strike rates and Control
One thing we need to be clear about is that we are judging performance, not ability. Hence, these rankings need to be purely outcome-based. I’m not focusing on factors like how many different shots the batter has in his or her arsenal, or how well the batter plays around the ground, etc. These showcase ability. I’m concerned with the outcome, which in T20 cricket should be controlled striking. How good was the striking, and how controlled the batter was. The analysis is done for different lengths and is separate for both pace and spin.
Absolute and Relative values
For each length (full, good, short of a good length, and short for pace; the same except short for spin), we calculate the strike rate and control percentage of the batter. A mean is taken with weights either equal to 1 for all lengths or in the ratio of how much the batter faced each length (two different modes). This forms the first layer of absolute metrics. However, this is insufficient, as we fail to account for factors like pitch conditions, bowling quality, etc.
We need a relative layer for this — a baseline against which we can compare the batter’s performance. For this, I used the non-striker’s performances. The metrics remain the same: strike rate and control on different lengths. The values in the relative layer are simply the ratio of the batter’s strike rate to the non-striker’s strike rate (intent) and the ratio of the batter’s control to the non-striker’s control (reliability). Again, depending on the mode, a mean is taken of the intents and reliabilities across different lengths.
So our current formula is this:

I’m calling SR, Control, Intent and Reliability as our base parameters.
The Variation Penalty
Imagine a case involving two batters:
Batter A has strike rates 250, 250, 50, 50 on four lengths.
Batter B has strike rates 150, 150, 150, 150 on four lengths.
The mean for both batters is the same, i.e., 150. But should we give them the same score? If the bowling team is smart, they’ll realise it is easy to contain Batter A. Batter B has performed better across lengths, whereas A would have struggled against smart bowling attacks.
We need some kind of penalty to differentiate between these cases. Each of the base parameters in the formula above needs to be in the form of:
where alpha is the aggression parameter we can control.
Two questions now - the penalty calculation and deciding on a suitable value for alpha.
For penalty, I use weighted standard deviation of all the values across lengths. Again, taking weights depending on the mode. Each base parameter is now:
Next, I need a good alpha. I introduced a condition here -
If for batters A and B having values (a1,a2,a3,a4) and (b1,b2,b3,b4) respectively on four lengths (or three for spin) and following -
Then, batter A should always be scored greater than B, no matter how high the variation is for A and how low it is for B. In simple terms, we don’t need the penalty term to be so high that it ranks a high variation high performing batter across lengths lower than a low variation low performing batter. For this, I ran simulations, collecting random values for A and B that mimic cases where A is better on all lengths, and found the highest alpha I could use. The value was 0.5. (I did the same on three lengths for spin and got 0.7, took a minimum of both and went ahead with 0.5). The formula applied on all base parameters updates to
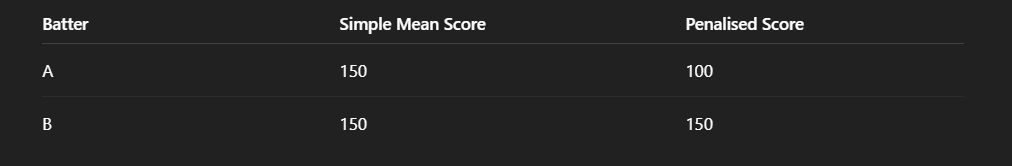
Multiplying this for all 4 parameters is our current performance score. Let’s see how the scores for batters A and batters B who were having a mean of 150 update with the new penalty based score.
Competition Weights
There’s still one problem yet to be solved. The relative layer we have used is biased in favour of poor quality around the batter. The ratios of batter metrics to non-striker metrics could be high because the other batters are just not good enough. The calculations would rate Abhishek as a better batter if he were playing for Bangladesh, let’s say. For this, we need a batting quality/competiton factor as a function of the environment in which the batter is playing. I have used competition as that environment. This is how I went about calculating competition quality factors:
Competitions in consideration
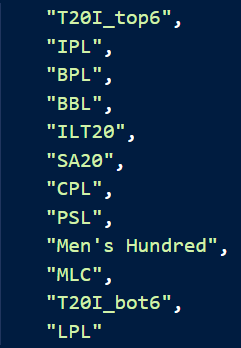
This is the list of competitions I am considering for this analysis. The rankings also will be based on performances in these. T20I top 6 are top 6 International batting sides - IND, AUS, RSA, NZ, WI, ENG. T20I bot 6 are PAK, SL, BAN, AFG, USA, UAE. The last 2 here are taken because of the presence of their leagues as we need common batters playing multiple competitions for this analysis. The time period I’m taking is since 2021.
Batter pool and relative performances
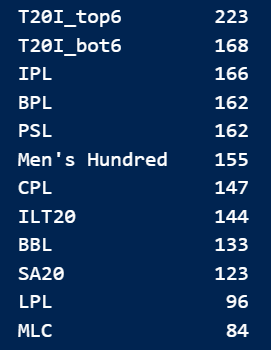
Next I need a group of batters who have played some amount of balls in atleast 2 of these competitions. I have a minimum of 10 balls for this, which is less but I account for this later on. After going through the entire dataset, I get a total of 511 such batters. I break the batter list in batter - competition pairs. For example, Glenn Maxwell - BBL and Glenn Maxwell - IPL are different entries. This is the number of entries I get for each competition:
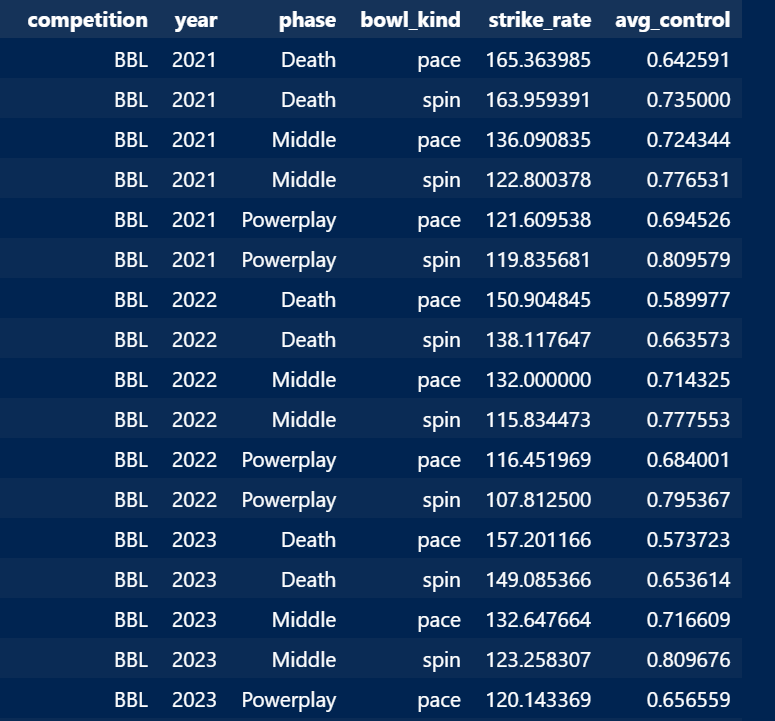
That’s good, we have a good amount of entries for each competition. We now need the relative performances of the batter in each competition. The idea is to see how difficult it is to overperform in different competitions. That’s why having the same batters playing in multiple competitions helps. I first created a baseline function, which is a function of competition, year, phase, and bowl_kind. The phases are PP (1–6), Middle (7–16), and Death (17–20). Bowl kinds are spin and pace. For each input combination, I calculated strike rates and control%. This is an example:
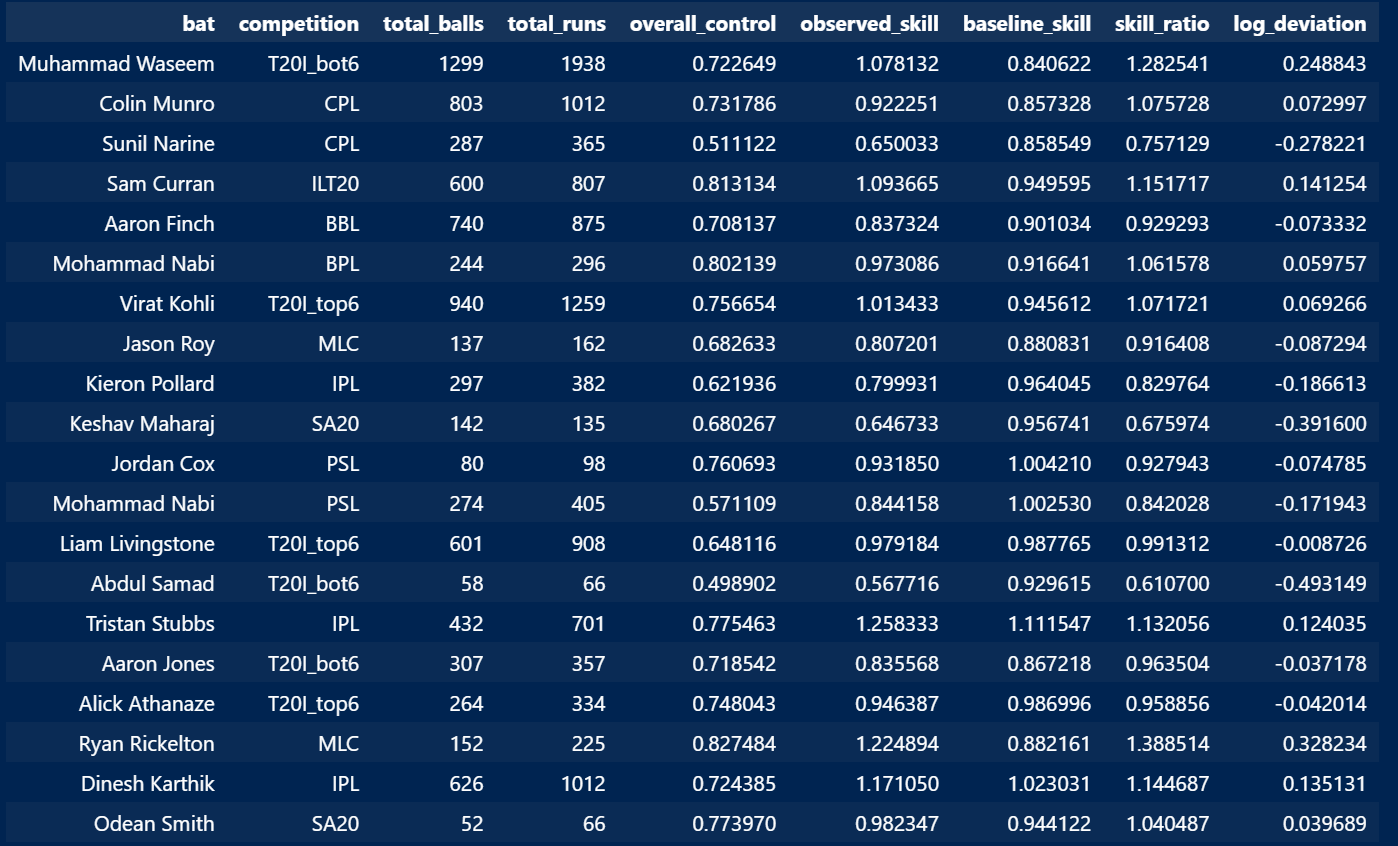
The relative performances for the batter are calculated using these baselines. Skill is defined as the multiplication of runs per ball and average control. For each batter–competition pair, all possible baselines (number of possible input combinations) are weighted by the number of balls the batter has played in that setting. A weighted average of these baselines gives the final baseline for the batter. The batter’s skill value in the competition is then divided by the baseline skill value to get the relative number (skill ratio) of the batter in that competition. Log deviation is the logarithm of the skill ratio.
Model and Final Weights
Next we feed these log deviation values in a mixed-effects regression model. The model predicts log deviation as a function of the competition while accounting for repeated observations from the same batter. Competitions are treated as categorical fixed effects to calculate effect of each competiton on relative performances. Batters are taken as random effects allowing the model to consider individual batter quality. We account for the minimum balls problem by giving more importance to samples with more total balls faced in the batter-competition pair.
The results were interesting. IPL surpassed T20I top 6 by 2.5%. Now this can happen due to two primary reasons - either IPL is just better than top international sides in batting quality or its difficult to peak in relative terms as a batter due to its high scoring nature.
(For those who follow me on X, the rankings I posted on X a few days ago differ slightly as I had not accounted for the low samples then.)
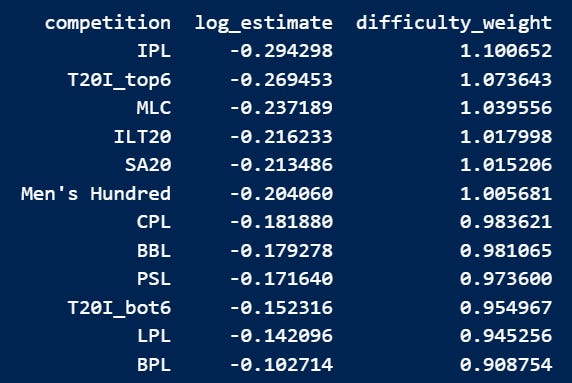
The top ranked IPL was 21.12% more difficult to attain good relative skill score than the last ranked BPL. For our rankings, this means we need to assign a weight of 1.2112 to IPL if BPL is assigned 1. LPL and BPL were the only competitions below T20I bottom 6 quality. These are final weights I have used for all competitions:
Putting it all together
Each base parameter now becomes:
The procedure ahead remains the same, we multiply all the base parameters. I give strike rate and intent twice the importance of control and reliability to obtain an overall quality score. I then break this score into striking ability and control ability, which are calculated as:
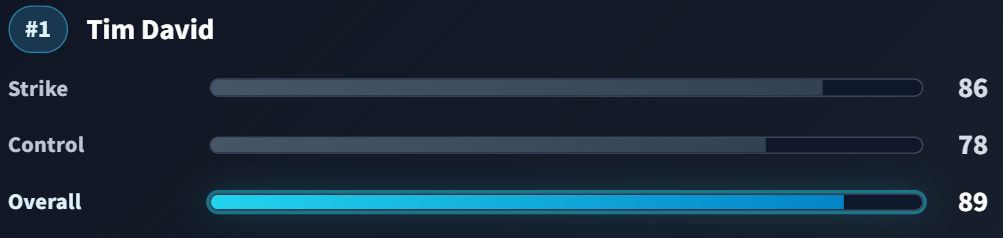
The rankings consider batters who have played at least 50 balls on each length (in the last two years) that we include in our calculations. This gives us 84 batters for the pace rankings and 112 for the spin rankings. All three scores: quality, strike, and control, are converted to a 0–100 scale using logistic squashing. This is how the scores look for the current best-performing batter vs pace, Tim David:
You can check out the rankings on this app - Batting Field Toolkit
Liked what you read? Do subscribe and share with fellow nerds!
I'm wondering what would be Arnav's performance score as a data scientist.
Amazing work