


From Intent to Impact
Introducing Intent Score and Intent Clusters for backup strategies

You hear any T20 discussions worldwide, and you’ll find the word ‘intent’ used every 30 seconds. The last few years in T20 batting have been a phase where analysts have thrown ‘averages’ in the bin, and people now can’t use this word without getting an orthodox tag stuck on the forehead. I didn’t want the tag, so I’ve decided to stick to intent.
One of the biggest headaches in franchise cricket comes with losing players to injuries, international commitments, etc. You want replacements who can play with the same intent you had with your selected one. But how do you compare the intent of players? There are phases of play to look at, pitch conditions to see, and the fact that the very definition of ‘intent’ is entirely subjective makes intent analysis a problematic area. The way I look at intent is the effort put in to score runs subject to the situation your team is in. That second part is pretty essential. It makes intent relative. When your team is at 200 for 2 in the 19th over, getting ten runs in the last over doesn’t help, but when you are 30 for 4 in 6 overs, trying hard to get those singles matters a lot.
How does this work?
So to understand intent comparison among batters, I’ve used intent graphs. An intent graph is a sequence of ballwise effective strike rates of the batter, with the effective strike rate being the batter's strike rate compared to the team in that phase. The use of effective strike rates accounts for the relativeness of intent. Also, I’ve used an out-frequency sequence to know which batter is achieving the intent for a longer period of time and which one is getting out on the second ball after hitting a six. For the bowlers, we can use the same metrics; the meaning associated with them changes. The effective strike rate tells us the run-conceding tendency and the out frequency gives us a measure of wicket-taking ability. For batters, I’ve also separated them for spinners and pacers to add another dimension for comparison.
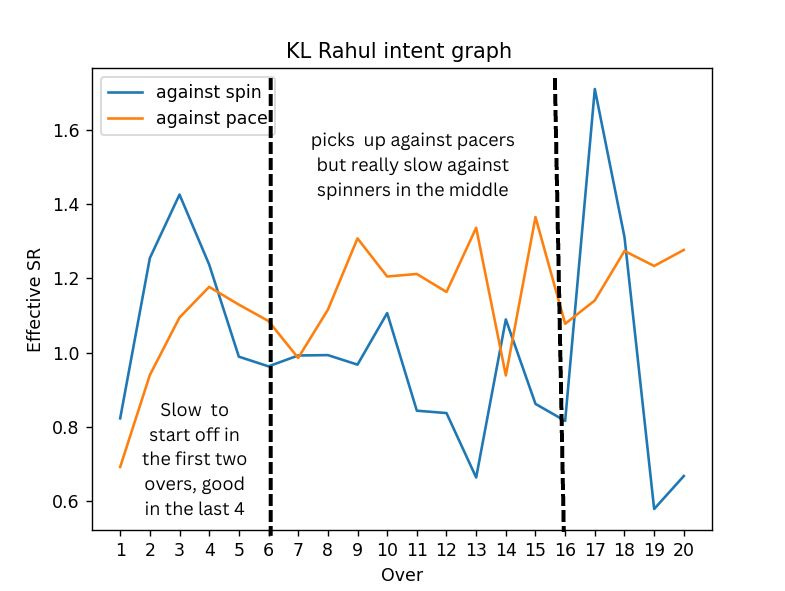
Intent graphs provide a great visual comparison between players. The following graphs for example provide a comparison between two of the most destructive batters in T20 cricket. Its easy to observe how Russell pips Klaasen against pace. Klaasen on the other hand, has higher peaks against spin. Here average is the intent score of the batter, which has been discussed later.


Another factor here is how much recency do you consider, which is controlled by the recency factor. The recency factor is a value between 0 and 1 controlling the weight of recent matches, with 0 being the most and one being the least. A factor of 0.98, for example, gives around 50% weightage to past 30 games. We've taken this for our analysis.
Now I want to group these players using a clustering model based on these sequences, giving rise to intent clusters.
The following example might give you an idea of what this is about. I tried finding players with a similar intent pattern as Yashasvi Jaiswal, and this is the order (decreasing similarity) I got –
E Lewis, PP Shaw, V Sehwag
It's not surprising, I feel, given that all of them tend to go hard in the powerplay.
Let’s try for another player. This time I have taken Mustafizur Rahman, a bowler who uses pace variations really effectively and is generally the captain’s go-to at the death. The output was –
AJ Tye, OC McCoy, SM Curran, MA Starc
Again, this looks like a good set of players to compare Rahman with.
However, One big problem with anything involving unsupervised learning is that you can set the optimal parameters following mathematics, but you are never sure of the real-world results. The above two examples are somewhat explainable, but there will be cases where the model predicts something unusual that doesn’t sit right in the head. An excellent example of this is when I gave Gautam Gambhir as the input, the order I received was –
'R Dravid', 'JM Bairstow', 'JH Kallis', 'LD Chandimal'
Gambhir and Bairstow are similar. One would not have thought of it naturally. I tried finding reasons which explain this. One very interesting observation by Prof. Srinivas Bhogle was that for both Gambhir and Bairstow when they start hitting boundaries, they keep going for it, which is precisely what intent distributions look for. We also have to consider that we are using relative parameters for comparison. So Gambhir might actually be faster than we thought, or maybe it’s the opposite for Bairstow.
INTRODUCING INTENT SCORES
Intent scores are a measure of how well a batter strikes in comparison to his teammates. A score of 1.2 for example means he strikes at 20% more than others. Similarly, 0.8 means he is 20% below others.

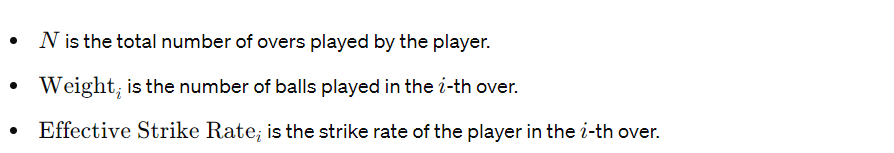
This intent score shown above is with respect to the match strike rate, which involves the contribution of the player as well. To remove that we further apply function f(x) = x/(2-x) on this intent score.
The following images show the best intent scores for batters above 1000 runs.
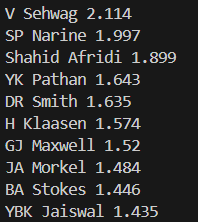

These scores bring out some very obvious matchups for a lot of players. Livingstone, who has a score of 1.852 against pacers, dips at 0.709 against spinners. Similarly, Stokes has a score of 1.446 and 0.924 against spinners and pacers respectively.
INTENT CLUSTERS FOR BACKUP OPTIONS
The general metrics used for forming these clusters for batters as explained earlier were effective strike rates and out frequencies against pace and spin. But these can be tweaked according to the requirement. Let’s say you are CSK, and you’ve bought Eoin Morgan as a middle-order bat, but for some reason he’s unavailable. It’s a typical Chennai track this year and you need a replacement who has a similar scoring intent against spin. You feed the model effective strike rate against spin as the only metric to consider. The output is Ross Taylor. One can easily validate the working of the model using this plot and see how both of them almost coincide -

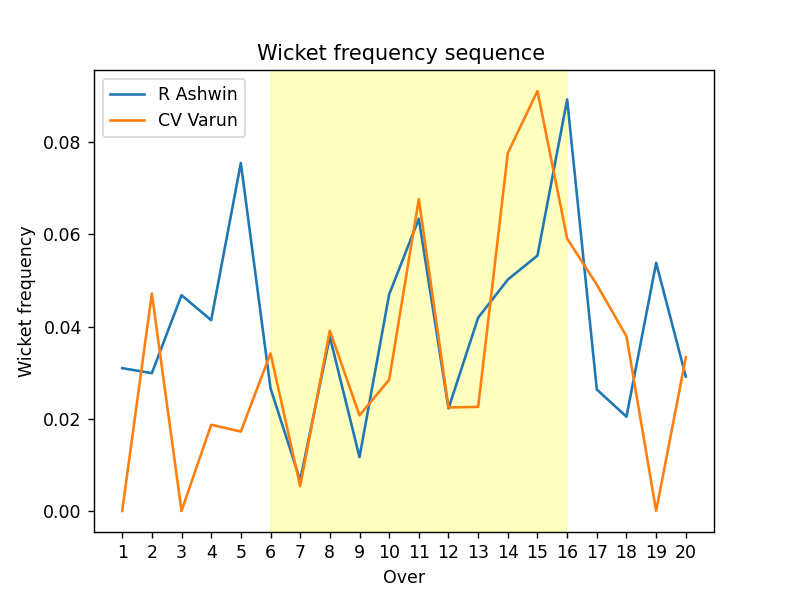
In 2019, Punjab Kings spent 8.4 crores on a young Varun Chakravarthy. Clusters show how similar he has been to their then captain R Ashwin in terms of wicket taking in the middle. The region marked in yellow in the plot below illustrates the same.
INTENT CLUSTERS FOR SQUAD BUILDING
The question that gave rise to this work was regarding backups in a franchise squad. Can you target backup players such that you can have a like-to-like competing eleven ready for each of your playing eleven players? The following might give you more clarity.
(Data- Pre IPL 2024. This analysis is done purely on the basis of intent sequence.)
For example, let's look at possible backup options for Rajasthan Royals batters and bowlers

Similarly, for CSK –

The fact that I hadn’t separated spinners and pacers beforehand, it is the model that automatically separates them for us gives a good validation on how effectively these clusters provide a distinction between different kinds of bowlers as well.
FUTURE SCOPE
T20 cricket has become a game of phases. The role definitions and requirements of each player are becoming more distinguished. Stats, though, don’t provide the entire picture, as there are too many factors to consider. Machine learning is thus where analysts have to go. Talking about intent specifically, I see it being relevant until T20 remains relevant. There hasn’t been any good quantifications of intent yet. Thus, intent clusters solve the dual problem of carrying out a role-wise analysis while keeping in mind the relative nature of intent.
Feel free to reach out with ideas and suggestions on arnav1204aj@gmail.com.
Loved it