
Context is King
A test cricket batting model to provide context aware baselines for judging batters

It’s impossible for a human mind to consider and evaluate all factors affecting a Test match knock simultaneously. Even judging batters within the same generation is a futile exercise, let alone drawing conclusions across eras. You can look at specific attributes, of course, but the most ‘error-free’ way to assess Smith and Root statistically would be to ask Smith to play all the innings Root has played and vice versa.
An ML-based approach can help overcome some of these limitations. The idea is to feed a model with important contextual features of the situation a batter walks into during a Test match. The model then produces an estimate of the runs it expects the batter to score (expected RPI). Comparing the actual return with this estimate allows for a more context-aware evaluation.
FEATURES AND MODEL
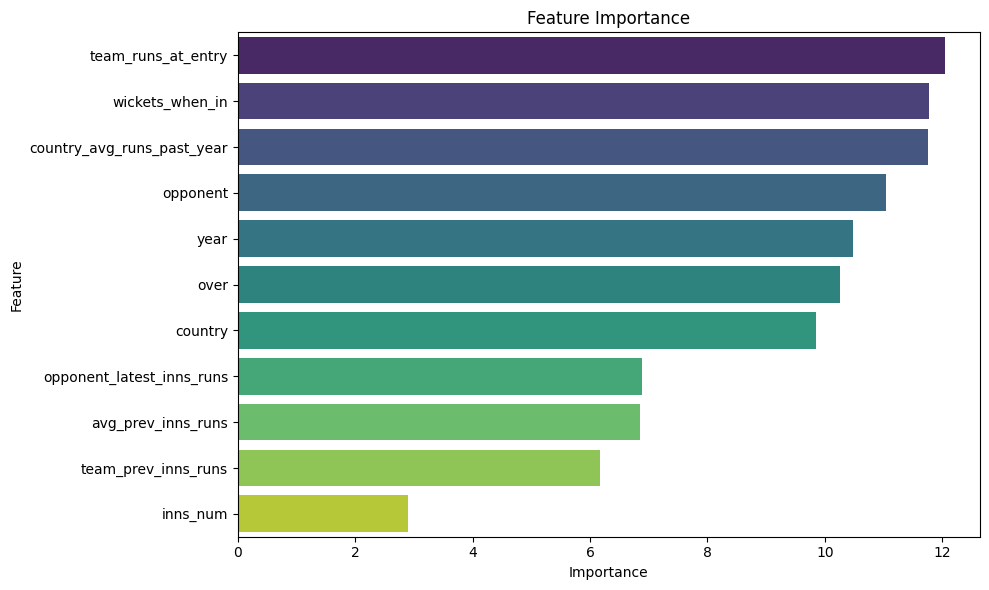
The model includes the following features:
Opponent, Host Country, Score when batter came in (runs and wickets), Year, Innings Number, Average runs of the previous innings of the match, Team and Opponent’s previous innings runs, Over number, Avg Innings Score of the past year in the country.
This looks like a rich set of factors to consider for one innings of a batter. Imagine asking your mind to process all these when you see a batter getting a hundred. The features are fed to CatBoostRegressor with runs scored by the batter as the target variable. I’ve used it primarily because it deals well with non-linear relationships. Data used is past 25 years of International Test Cricket till the WTC 2025 Final. The model helps us see what indicators are the strongest in determining how a batter would perform.
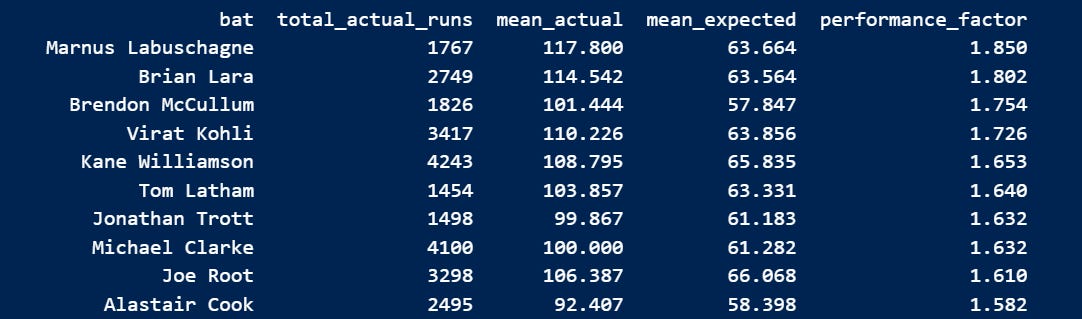
I’ve wrapped all of this in an app. Do check it out. This is a table from the app of batters who have performed the best with respect to what was offered to them by the conditions:
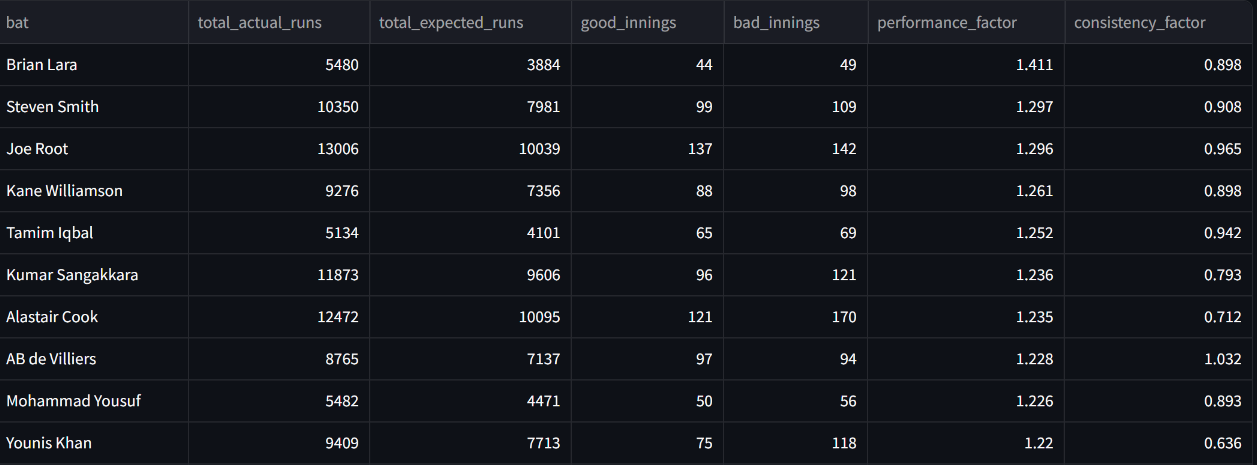
Here Performance factor is given by ratio of actual runs and expected runs. Consistency factor is ratio of good innings to bad innings.
Good innings is when actual runs exceed estimated runs, else it is a bad knock.
The values are subject to change as I update the model with new data or better parameters.
SEPERATING EXPECTATION AND EXCEPTIONALISM
The biggest disadvantage of using plain average is that you don’t know what’s driving it. Let’s say we want to compare how easy/difficult it has been year by year for different batting positions. The most common approach is to compare batting averages of these positions. High averages are linked to ‘batting at this position has been easier’. And this works if you have a large pool of batters because it will include players of different qualities.
But what if we reduce our problem to: compare the ease of batting for number 4 Australian batters in 2001 to 2014 (Case A) vs 2015 to 2025 (Case B). In plain runs per innings terms, Case A is at 37.27 and Case B is at 45.28. But we know that doesn’t mean B is the easier era because we’ve got the best batter of our generation batting there. The model is able to separate this fact and judge how an average batter would perform in these cases. And these are the model RPI estimates:
CASE A – 41.12
CASE B – 38.47
What this means is that Smith has averaged better in what has been a more difficult time. This also goes to show that RPI estimates provide a much more accurate picture of difficulty.
And using these estimates, when we see how positional difficulty has varied across 5-year spans in Test cricket, this is the plot we get:
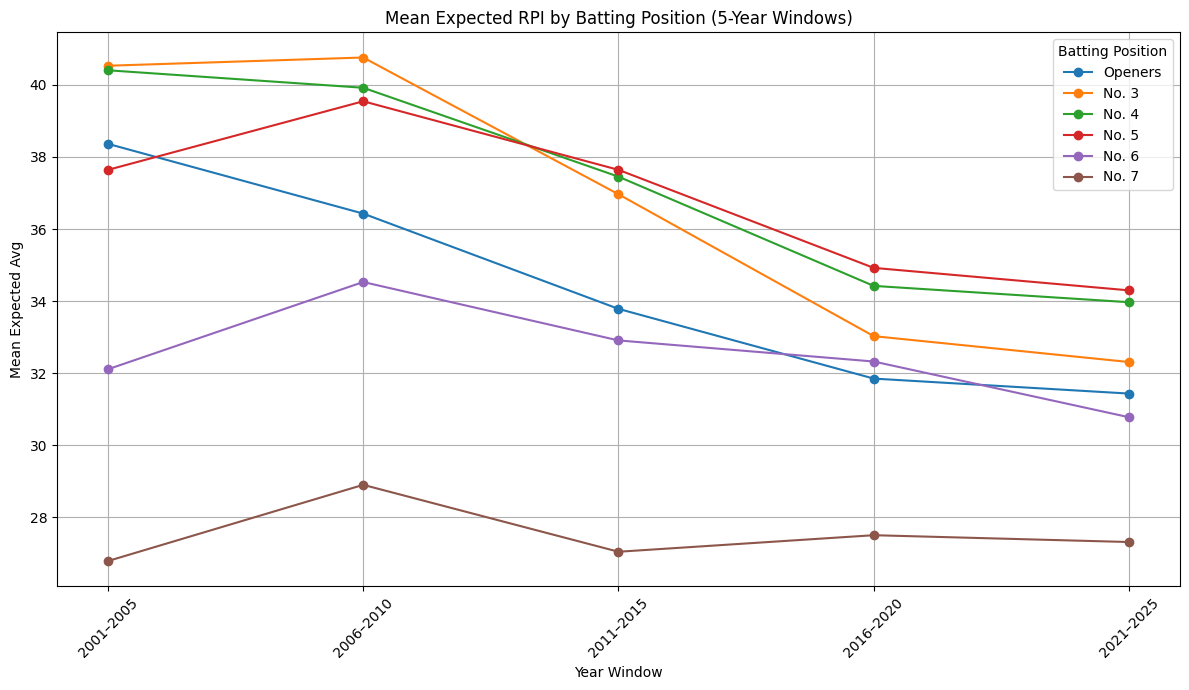
Number 4s and 5s lead currently.
Number 3 position falls from being the best to now third.
The gap reduction between number 6 and openers is striking, as opening becomes the toughest role among top 5 batters.
Long way to go, but what some of the young batters have done is worth appreciating. Jaiswal is at 49.94 RPI compared to a 33.41 estimate. Brook probably plays at the easiest position in world cricket – an English number 5. He needs to average a staggering 49.22 RPI to break even. But he still overperforms with 58.48. Kamindu Mendis is on 56.38 RPI and has an estimate of 36.64. My fear is a lot of potentially all-time great batters of the current generation might end up averaging 40, which doesn’t attract people to have them in conversations of all-time greats. A model that provides context of the situation in which they played thus helps.
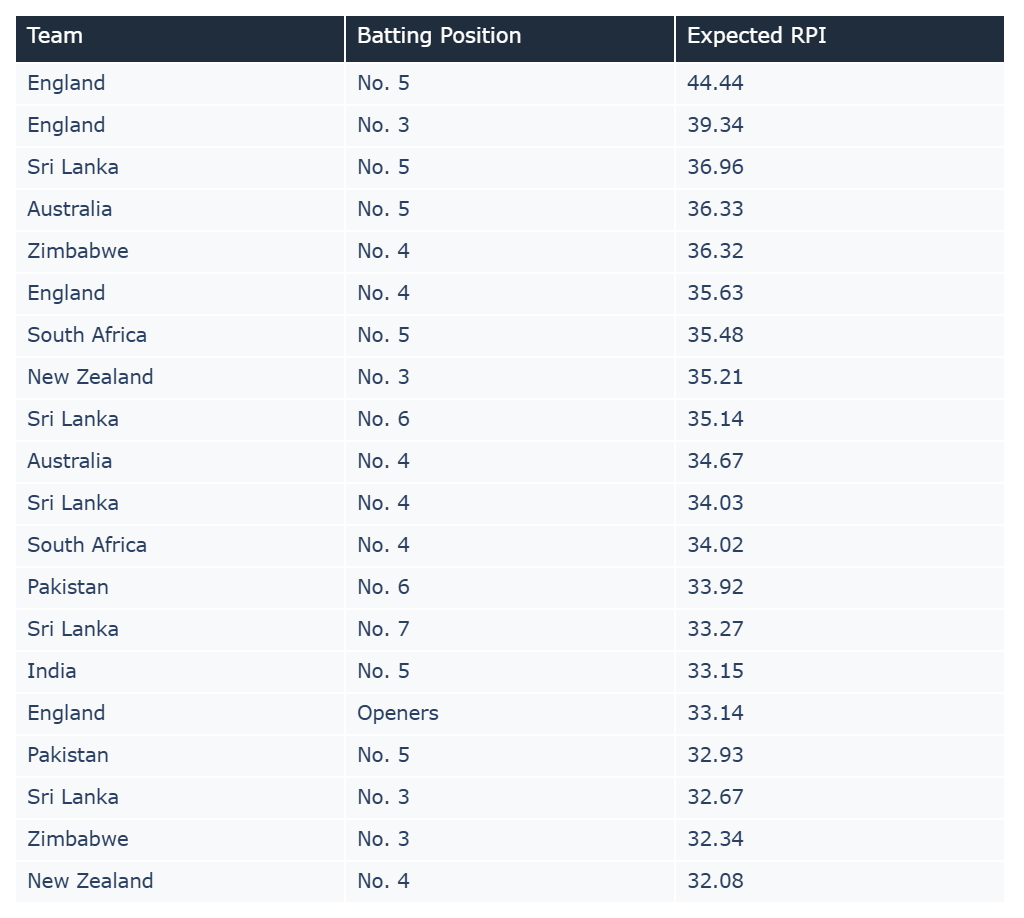
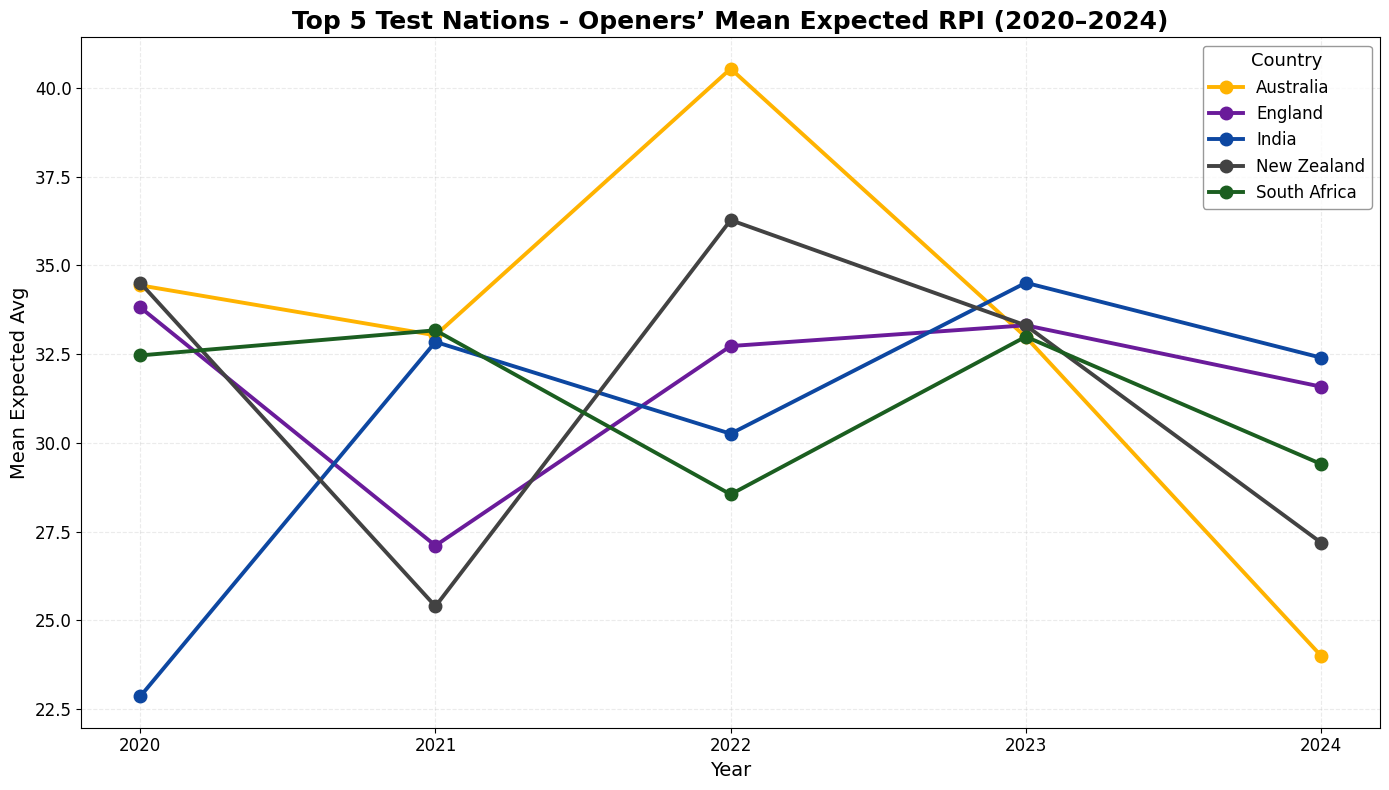
Australia is struggling with openers, but the conditions around them are not helping either. The expectations are high, but the situation for an Aussie opener has worsened significantly. In the last 2 years, opening for Australia has been the second toughest job to do (expected RPI = 25.92) after being an India number 7 (24.36) among top 7 positions in the best 5 Test nations. It was the best opening role in 2022.
HOME AND AWAY
The mandatory Bazball section
I heard Jarrod Kimber saying recently that Indian batters might be short of confidence because they are not able to score at home. It got me thinking whether runs at home translate away? And whether England batters in the Bazball era and with the flat home pitches are able to perform well outside? The answer is yes.
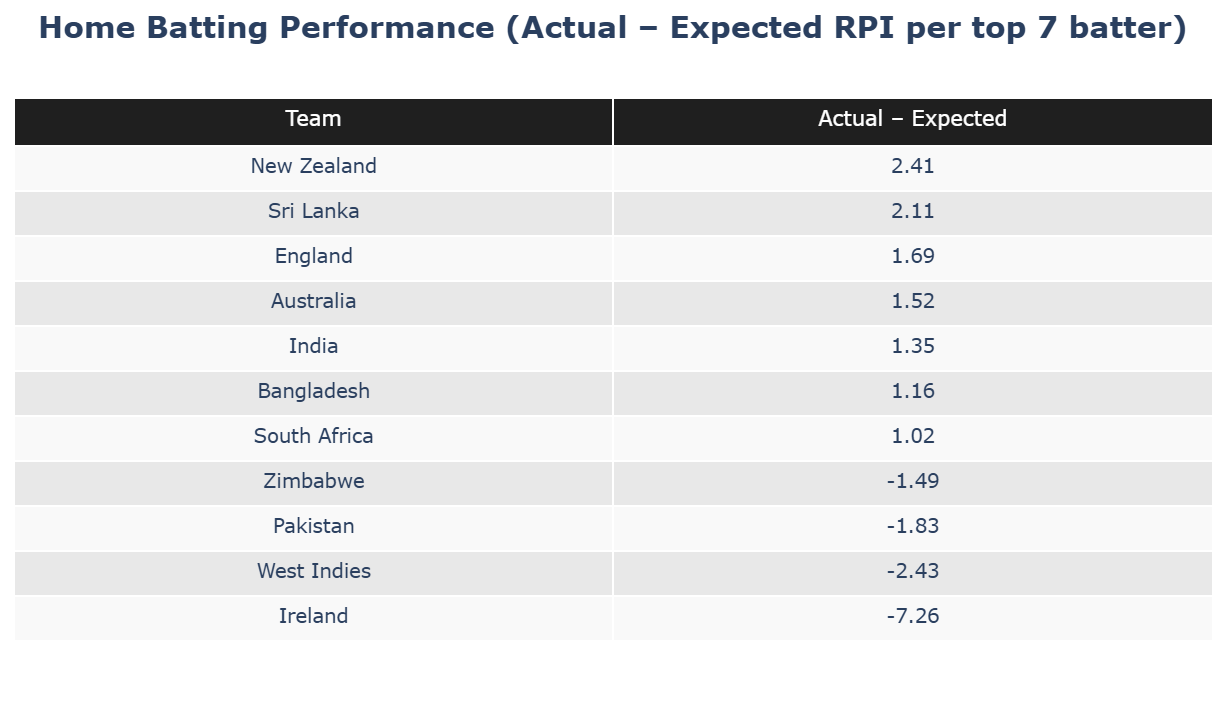
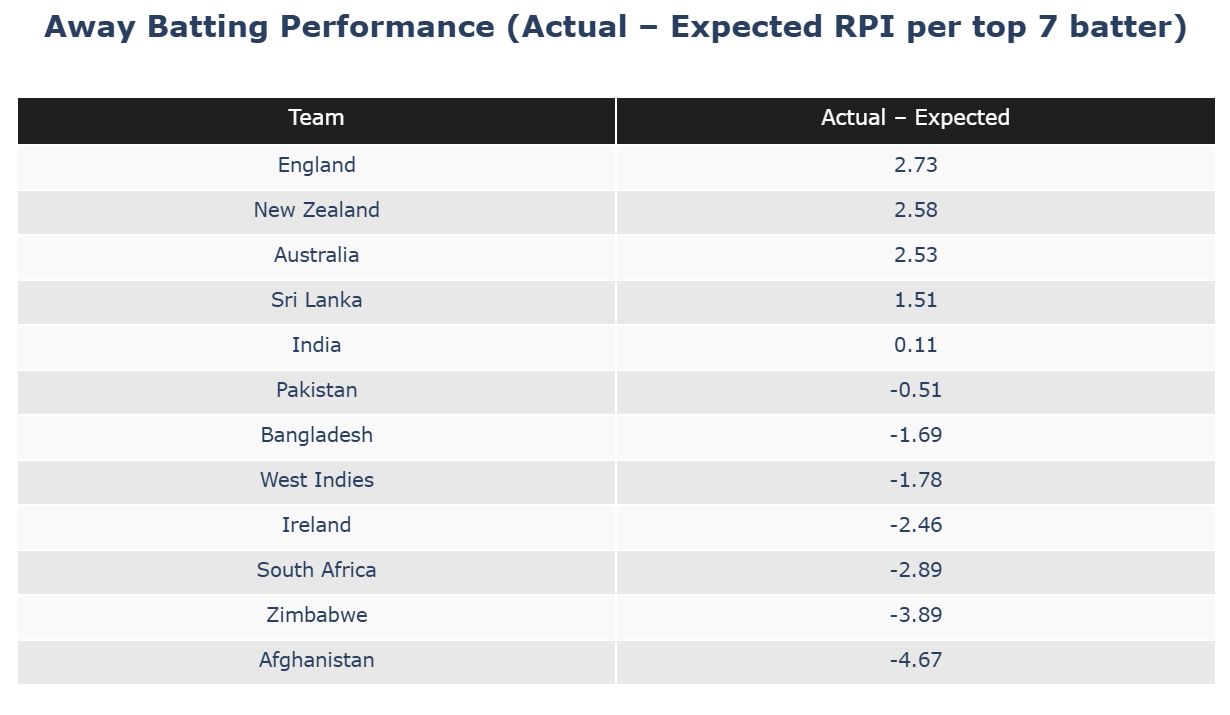
New Zealand and Sri Lankan batters have runs at home and they do better than the model’s estimates. England is third best at home, but their batters have been the best performing away. In fact, all 4 top countries (these three plus Aus) having a considerable actual – expected score playing away are also the top 4 playing at home.
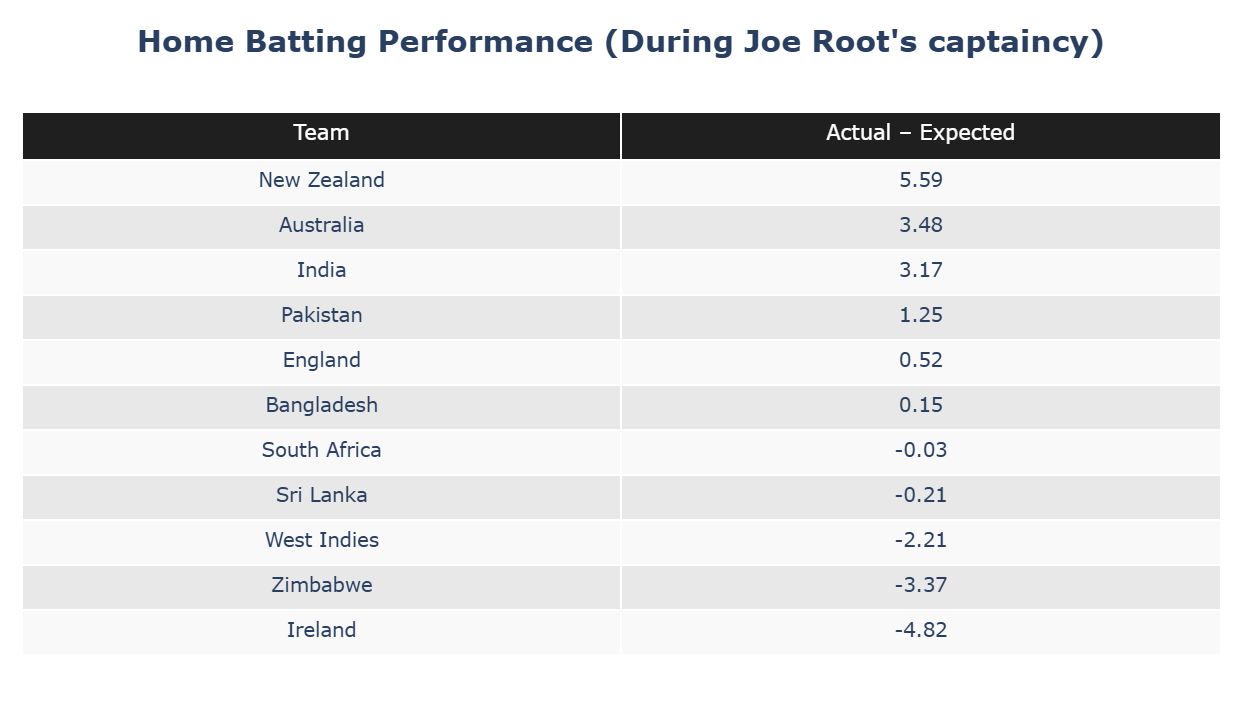
This was not the case for England in Root’s tenure, which was a phase dominated by a proper home batting advantage for New Zealand, Australia and India batters.
India in India and Visitors in India
Visiting batters have enjoyed their best 5 year phase when coming to India in this century. The previous 10 years were mostly them coming and performing below expectations.
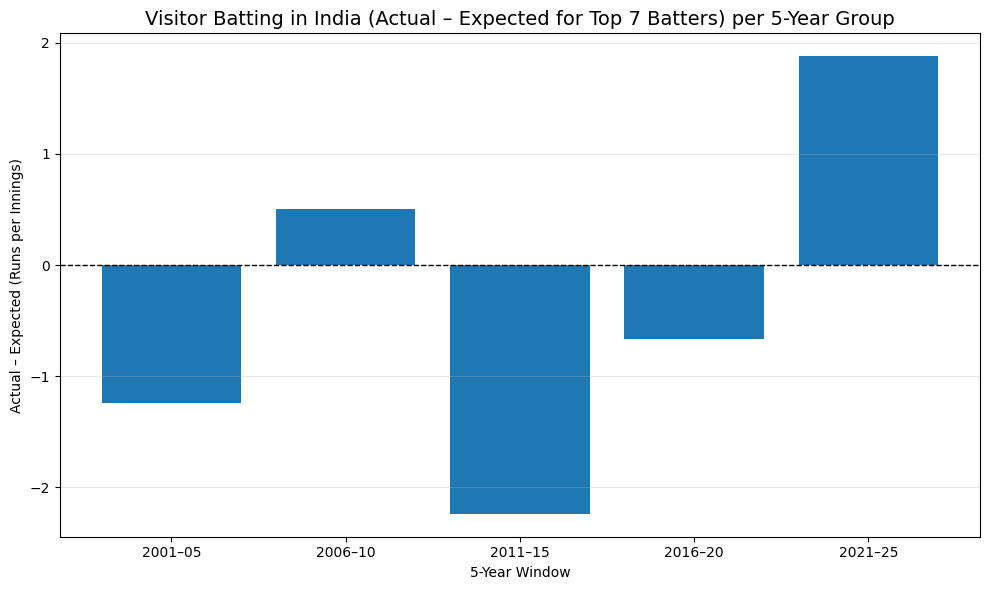
This coincides with Indian batters experiencing a sharp decline from an incredible 2016–2020 phase to aggravate problems. In fact, India 2016–20 is the second-best 5-year home phase in this century after New Zealand 2018–22.
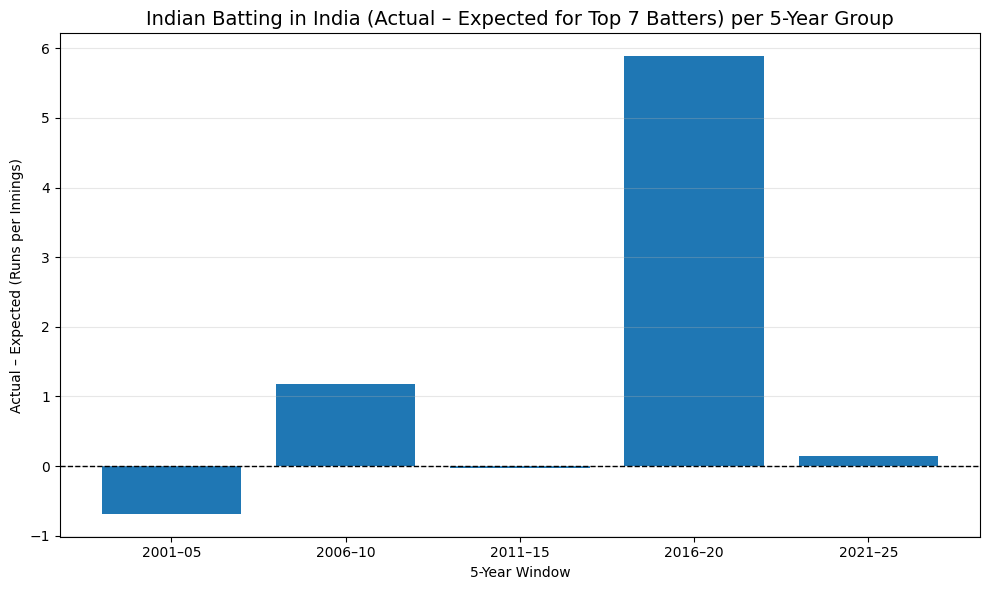
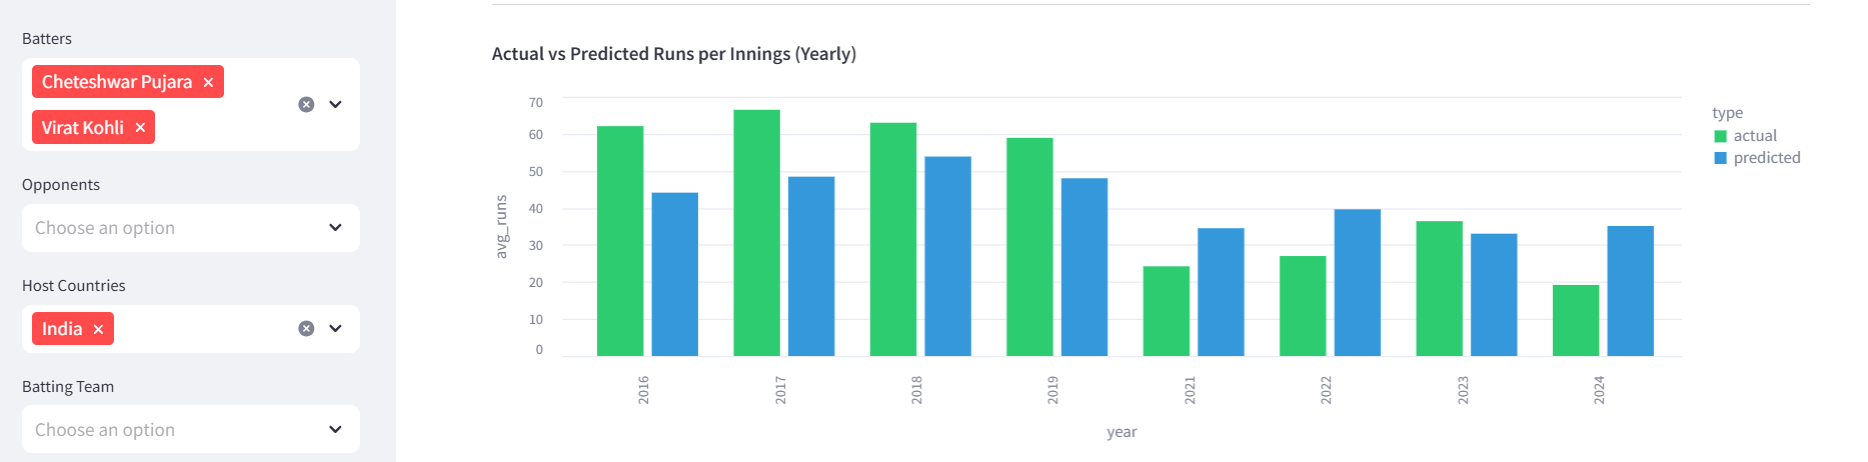
Pujara and Kohli’s home performance is one of the major reasons for this shift.
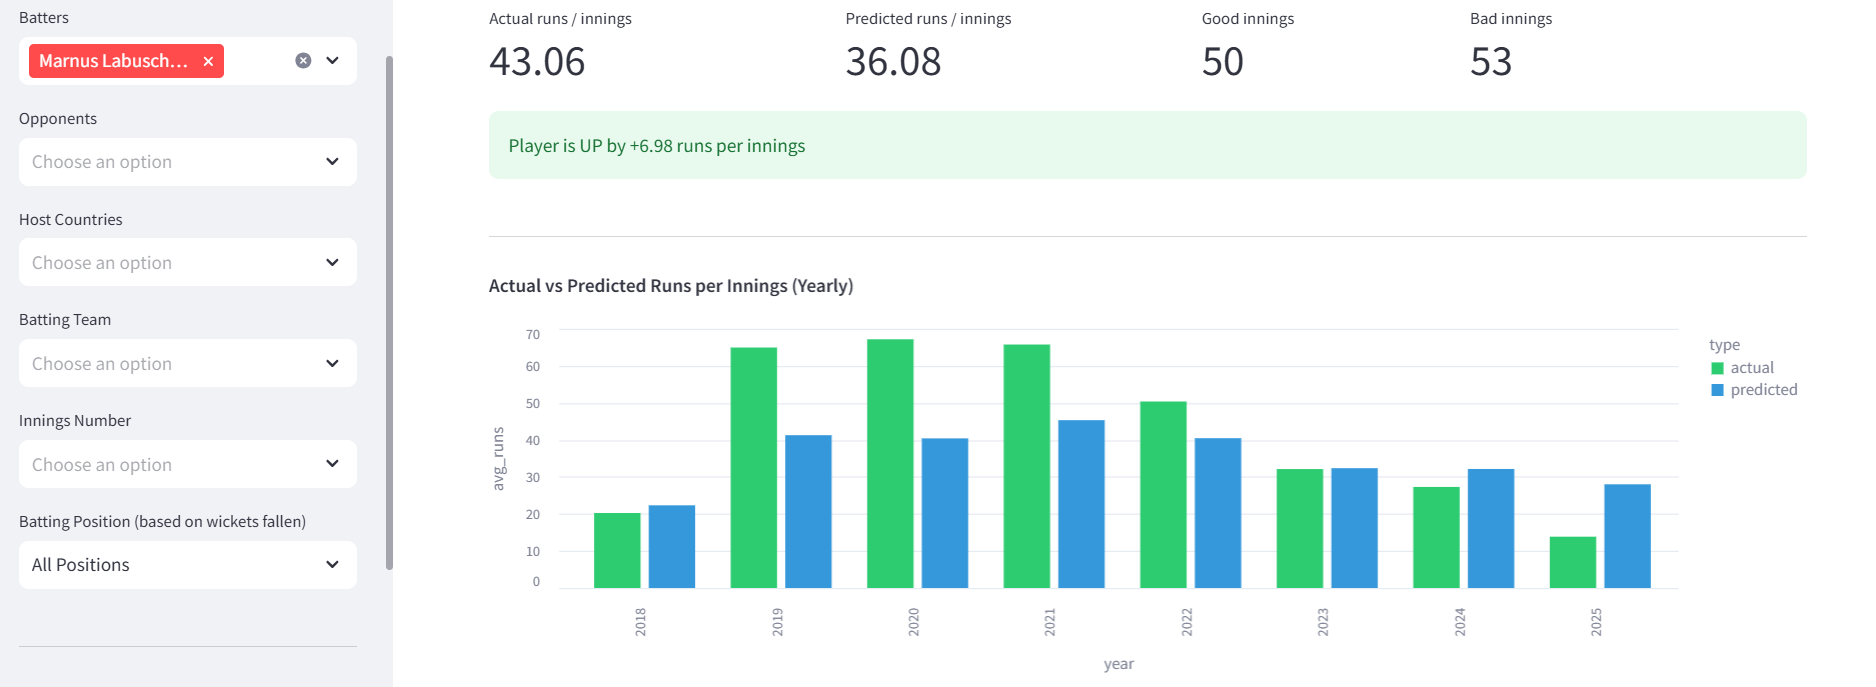
THE FALL OF MARNUS LABUSCHAGNE
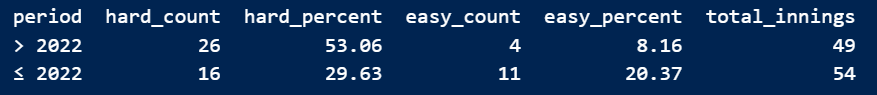
For this analysis I have considered two varieties of batting conditions:
Easy: expected RPI ≥ 50
Hard: expected RPI < 30
Marnus performs well in easy conditions. Won’t everyone perform well there? Yes. But I mean this in terms of performance factor. He bats better than everyone when conditions are easy, but he is over-dependent on those conditions. Among all batters with 1000 runs in these conditions, he stands at the top with an RPI of 117.8 and a performance factor of 1.85.
What happens to him in hard conditions? His RPI drops to 19.12, and his performance factor drops to 0.87. And these are mostly the pitches he has had to encounter post-2022. Hard conditions have shot up from 29% to 53%. Easy conditions have gone down from 20% to a mere 8%.
Great work, Arnav!
https://theunseengame.substack.com/p/the-unseen-game-icr-metric
Check this out. I had written on a Contextual metric superbly useful in T20s that changes the way we rate performances.